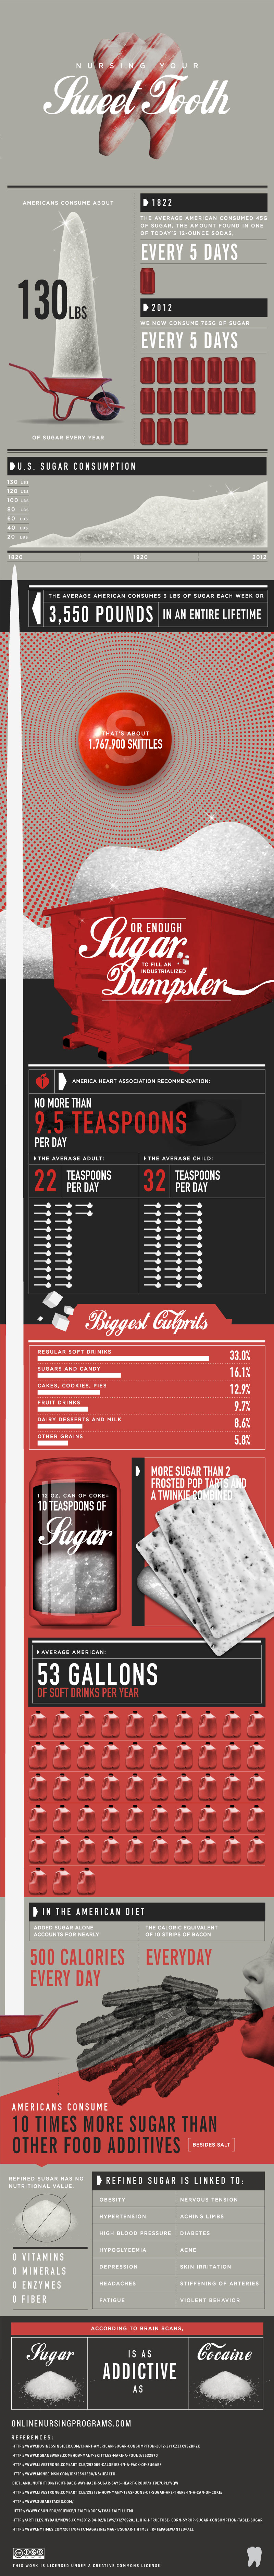
InfoGraphic on Sugar Consumption
This info graphic paints a startling picture about our diets and the amount of sugar we consume. What is worse is the health risks refined sugar is linked to; obesity, high blood pressure, headaches and clogging of arteries just to name a few. It is important to monitor and reduce our daily intake of sugar,