All posts tagged: health

InfoGraphic of Big Data in Healthcare

InfoGraphic of Big Data in Healthcare

As we can see from the infographic, diagnoses can be inaccurate and can lead to death. Although big data can play a mayor role in decreasing misdiagnosis, in return lowering healthcare costs and improving patient care, isn’t it our responsibility to ensure a holistic approach to our health and wellness. One such method is ozone

InfoGraphic on Top 10 Methods to Beat Aging

Aging, an inevitable part of life on Earth, but some carry their years better than others. Here’s a list of the top anti aging methods. You may need some help with some of these, like a gym buddy to help keep the exercise routine up, ozone therapy or massage therapy to reduce the stress levels,

InfoGraphic on the 40 Hour Workweek,

InfoGraphic on the 40 Hour Workweek

Work, a modern day necessity for most of us. The question might even arise that are we, the employed, the real slaves of a nations economy. Then we look at the hungry and the poor, the billionaires and jet setters, and we realize what monetary emancipation can do for a person. The true question comes

InfoGraphic on Drug Abuse in the Workplace,

InfoGraphic on Drug Abuse in the Workplace

As many things in life, drug use doesn’t end during personal hours and get’s taken to the office more frequently than expected. This has various consequences as shown in the info graphic, but how does one quit? Many times counseling alone is ineffective, because the craving for the next “fix” is just too strong. To

InfoGraphic on Good Food for Work,

InfoGraphic on Good Food for Work

The old adage “garbage in, garbage out” rings true yet again, this time in relation to our work performance and the diets we have. Making small changes in the office can have huge benefits for a company, be it providing nutritious and healthy meals, having exercise schedules or detoxifying employees in ozone saunas, it can

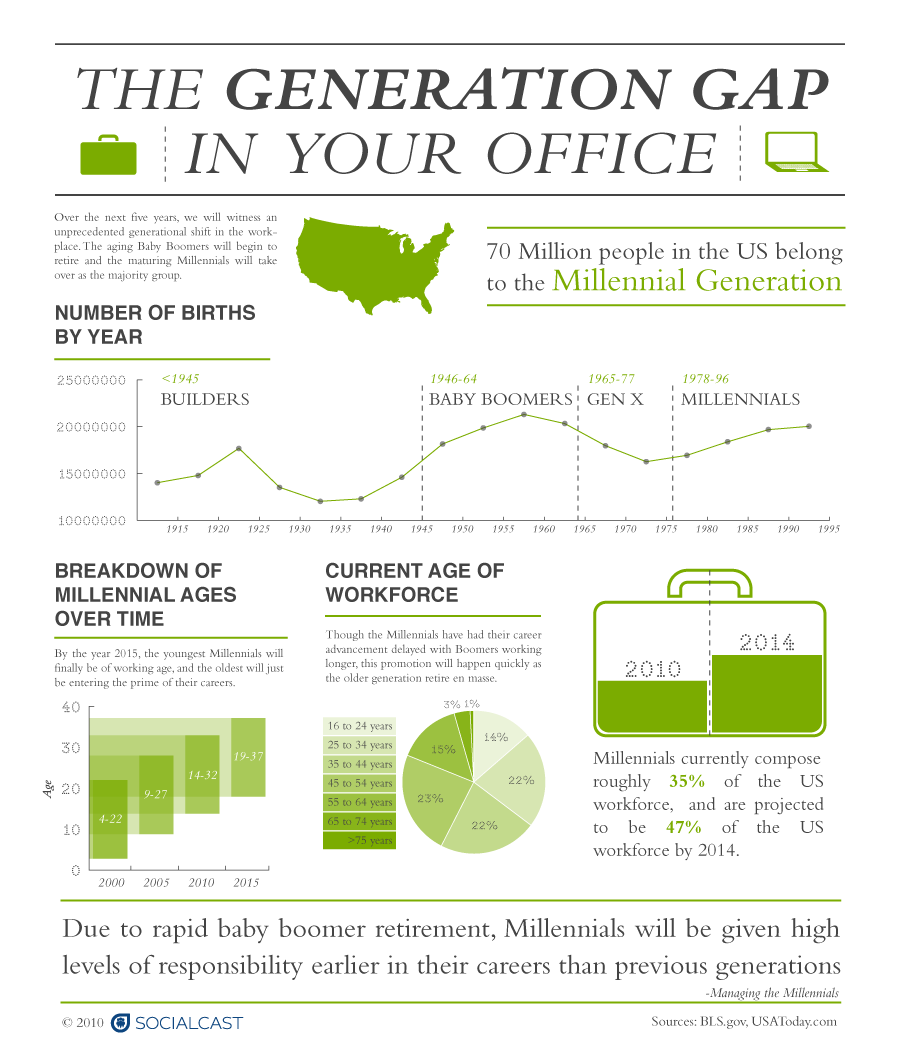
InfoGraphic on the Generation Gap in your Office,

InfoGraphic on the Generation Gap in your Office

The info graphic below depict the construction of the US workforce. Many other countries are in similar situations, where the increase in Millennials responsibilities can cause severe global stress level increases. More focus must be given to streamlined transitions between baby boomers’ retirement and the rise of the millennials. Luckily the World is moving towards

InfoGraphic on Food Safety,

InfoGraphic on Food Safety

An apple a day keeps the doctor away… but not when that apple is rotten! Our best dietary choices might come to nothing when those foods aren’t acquired, stored, prepared and consumed right. The info graphic below guides us in our quest to preserve, prepare and consume food to have the optimal nutrient intake from

InfoGraphic on the Cost of Healthcare Fraud,

InfoGraphic on the Cost of Healthcare Fraud

A key element in the info graphic below is the increase of healthcare costs during the last decade. This can be due to a number of factors, fraud, salary increases, research and development costs of drugs etc, but this is forcing many people to rather live healthier lifestyles or to look at alternative ways to

InfoGraphic on the Entities that saves workers' Lives,

InfoGraphic on the Entities that saves workers’ Lives

With the development of a nation comes the expansion of entities that must regulate, control and protect the citizens. The info graphic below looks at some of the entities in the US that saves lives every day through the enforcing of safety regulations. From occupational health to substance abuse to driving, all must be covered

InfoGraphic on the Cost of Obesity,

InfoGraphic on the Cost of Obesity

Weight, the eternal struggle of mankind. Very few people does not have a weight problem of some sort, either because they are too skinny, or they want to shed an extra couple of kg’s. Many times these are unfounded and only a personal problem, but due to the lifestyle changes obesity has become a problem